What’s Happening?
In water, nutrients exist in many different forms. Whether nutrient concentrations are ecologically beneficial or detrimental depends on the nutrient’s form and concentration, both of which are influenced by a variety of environmental factors (e.g., salinity, pH, temperature). Estuarine nutrient concentrations also vary due to the timing and intensity of coastal upwelling, precipitation patterns, estuarine geomorphology, and tidal flushing.
In this document, we summarize available information on nitrogen, phosphorus, silica, and chlorophyll a concentrations (and their various forms) in the Coos estuary (Figure 1). The forms in which nutrients are found in the Coos estuary are listed in Table 1.
After a brief overview, this document summarizes nutrient water quality data for each project area subsystem (e.g., South Slough, Lower Bay, Upper Bay, Isthmus Slough, etc.).
Table 1. Nutrient forms found in aquatic systems. The table also provides formulas, brief descriptions, sources, and relevant water quality standards.
Nutrients are key water quality parameters. According to the United States Environmental Protection Agency (USEPA), nutrients in estuarine waters directly affect plant growth and biological productivity, and indirectly influence dissolved oxygen concentrations, water clarity, and sedimentation rates.
Nutrients enter estuaries from terrestrial point and non-point sources, atmospheric, and groundwater sources. Nutrient sources are both naturally occurring and human-caused.
When nutrients are excessive in estuarine waters, a process called “eutrophication” may result, causing excess plant production (phytoplankton or algae), which may lead to decreased water clarity and low dissolved oxygen concentrations, both of which are detrimental to aquatic plants and animals.
Sources: USEPA 2010, 2012
The concentrations of both nitrogen and phosphorus in the Coos estuary remained at acceptable levels throughout most years available for investigation. Based on the USEPA’s West Coast Criteria (USEPA 2012), all Coos estuary study sites (Figure 1) were ranked as “good” for total dissolved inorganic nitrogen (DIN) and orthophosphates (PO4 ) at < 0.5 mg/L and < 0.07 mg/L, respectively. Similarly, based on USEPA research (Brown et al. 2007), chlorophyll a was ranked as “good” at < 15 µg/L (Figure 2).
The ocean-dominated portion of the Coos estuary (salinity > 25) comprises about 42% of the entire system and has moderate concentrations of DIN (0.1-1.0 mg/l) and high concentrations of phosphorus (≥ 0.1 mg/L). The highest concentrations of both nutrients occur during April-June (NOAA 1998).
The upper, more river-dominated portion of the Coos estuary is considered “phosphorus limited,” because the bioavailability of phosphorus (rather than nitrogen) constrains the growth of photosynthetic organisms such as emergent tidal wetland vegetation and algae (known in ecological terms as “primary producers”)(Quinn et al. 1991).
Chlorophyll a concentrations in the Coos estuary generally meet USEPA standards (USEPA 2012) except for rare occasions in the riverine/freshwater zone of the estuary (see Figure 11 Winchester and Valino sites)(ODEQ 2007; SWMP 2012).
Silica concentrations in the Coos estuary range from approximately 0-18 mg/L, with the highest concentrations occurring in the riverine/freshwater zone of Isthmus Slough (SWMP 2012; ODEQ 2007, 2009). Silica exhibits seasonal patterns, with peak levels during the rainy season for riverine/freshwater sites and peaks for marine/polyhaline sites in the dry season (SWMP 2012). USEPA has not established water quality guidelines for silica.
buy Lyrica europe
Figure 2. This series of maps (previous page and above) summarizes wet and dry season nitrogen, phosporous and chlorophyll a conditions at Coos estuary water quality data collection sites. Green represents “good” nutrient concentrations that meet all USEPA standards; Orange represents “fair” nutrient concentrations that meet all but the most stringent USEPA standards; Red represents “poor” nutrient concentrations that do not meet any USEPA standard; and White represents data gaps, which occur at stations only sampled in the dry season (May-October). Data were compiled from : CTCLUSI 2013, 2014; ODEQ 1999, 2001, 2004, 2006, 2007; SWMP 2012.
Lower South Slough Watershed
Since 2002, the science staff at the South Slough National Estuarine Research Reserve (SSNERR) has monitored nutrient concentrations at four sites as part of the System-Wide Monitoring Program (SWMP)(Figures 3 and 4)(SWMP 2012). Additional sources of nutrient information for South Slough include: USEPA, ODEQ, local tribes (Coquille; the Confederated Tribes of Coos, Lower Umpqua, and Siuslaw Indians [CTCLUSI]), and the Coos Watershed Association (CoosWA).
Figure 3. South Slough water column nutrients study sites. CEMAP refers to data from Sigmon et al. 2006. State of Watersheds Report refers to Cornu et al. 2012.
Nitrogen
The 10 year record (2002-2012) of SWMP data in South Slough reveals a strong seasonal pattern in total dissolved inorganic nitrogen (DIN) which is high during wet months (November – April) and low during dry months (May – October)(Figure 5)(SWMP 2012).
Regression analyses of SWMP data also reveal a statistically significant (p < 0.001) relationship between precipitation and DIN at all stations (Figure 6). Precipitation explains 50% of DIN variation near South Slough’s mostly freshwater site ( R2= 0.497 at Winchester Creek). However, it explains an increasingly smaller share of DIN variation as salinity increases (i.e., sites closer to the mouth of the estuary). It should be noted that the statistical significance of these relationships may be somewhat inflated due to potential “serial correlation” in the data (when anomalies associated with one time period carry over into future time periods).
DIN concentrations were generally higher and varied more at the riverine/freshwater sampling site (Winchester) than at the marine/polyhaline sites (Boathouse, Charleston, and Valino)(Figure 7a). These results appear to be consistent over time (Figure 5).
Silica
Silica concentrations display seasonal patterns that vary across South Slough’s salinity gradient. At the marine/polyhaline sampling sites, silica concentrations decreased during the dry season and peaked during the rainy season. The pattern is reversed at the riverine/freshwater sampling site, with silica concentrations cresting during the dry season and falling in the wet season (Figure 10). The variability of silica concentrations is also a function of salinity, with riverine/freshwater sites fluctuating less than marine/polyhaline sites (Figure 7c).
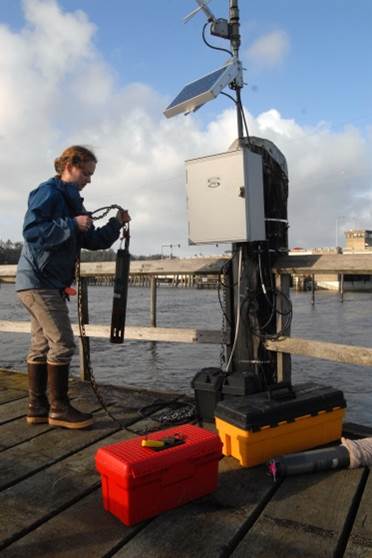
Figure 4. SSNERR staff member deploying a water quality data sonde at the Charleston SWMP station.
Chlorophyll a
South Slough chlorophyll a concentrations peak in late-spring and summer (Figure 11)(SWMP 2012). The concentrations are generally below the Oregon estuarine water quality criteria standard (15 µg/L) except for a few seasonal peaks at Valino Island and Winchester Creek in 2006 and the Boathouse station in 2007.
Chlorophyll a concentrations are relatively uniform throughout South Slough’s salinity gradient, with the exception of higher variance and a slightly higher mean concentration at the Winchester station in the riverine/freshwater zone (Figure 7d).
Upper South Slough Watershed
The Partnership for Coastal Watersheds’ State of the Watersheds assessment (Cornu et al. 2012) recorded variable nutrient concentrations in South Slough’s upper watershed streams from September 2010 to January 2012 (see sampling site locations in Figure 3).
Nutrients in South Slough’s upper watershed are well correlated with precipitation (Cornu et al. 2012). Concentrations of phosphate, ammonium, and silica increased during periods of low rainfall, and declined during the rainy season. Other nutrients, such as nitrate and nitrite, followed the opposite pattern (Figure 12).
Nitrate concentrations in South Slough’s upper watershed met ODEQ standards (1.0 mg/L) but did not meet the USEPA’s recommended 0.09 mg/L benchmark during the rainy season at Winchester Creek.
Figure 10. Seasonal patterns in silica concentrations in the marine/polyhaline zone (black) and the riverine/freshwater zone (green) of the South Slough plotted against precipitation (red). Nutrient data: SWMP 2012; Precipitation data: NWS 2014.
Figure 11. Average monthly chlorophyll a levels at South Slough sites (SWMP stations) during 2002-2012. Dashed lines represent Oregon estuarine water quality standards. Values below 15 µg/L are considered good. The legend lists sites in order of marine to fresh: Boathouse (blue), Charleston (red), Valino (yellow), Winchester (purple).
Data: SWMP 2012; Water quality standards: Brown et al. 2007.
Figure 5. Average monthly DIN at South Slough sites (SWMP stations) 2002-2012. The horizontal dashed lines represent USEPA’s water quality criteria. Values below 0.5 mg/L (in green area) indicate good condition, while values above 1.0 mg/L (red area) indicate poor condition. The legend is in order of decreasing salinity from Boathouse (marine) to Winchester (freshwater) sites. Data from SWMP 2012
Figure 6. Regression plots of precipitation and DIN at each of the four nutrient sites in the South Slough. R2 and p-values shown. Data: SWMP 2012
Figure 7. Density estimates describing the mean and variance of total dissolved nutrients at SWMP nutrient sampling sites during 2002-2012. Graph A: DIN; B: PO4; C: CHLa: D: SiO2. Sites listed in order of most marine (Boat House) to most freshwater (Winchester) sites. Density functions with higher mean values have peaks shifted further to the right; functions with more variance are wider.
Figure 8. Site location map of CEMAP sampling stations (A) and average DIN (B), PO4 (C), and chlorophyll a (D) during 1999, 2001, 2004. South Slough sites are mapped along with stations in the Lower Bay, Upper Bay, Haynes Inlet, Isthmus Slough, Catching Slough, and Coos River Subsystems. No data are available for the Pony Slough and North Slough Subsystems. Data from the CEMAP program by ODEQ, retrieved from: http://deq12.deq.state.or.us/lasar2/
Figure 9. Average monthly PO4 levels at South Slough sites (SWMP stations) during 2002-2012. Dashed lines represent USEPA’s criteria. Values below 0.7 mg/L (green) are considered good. The legend lists sites in order of marine to fresh. Data: SWMP 2012
Figure 12. Monthly ammonium levels for upper South Slough watershed streams (September 2010 – February 2012). Rainfall (blue), Elliot Creek site (red), Joe Ney Creek site (green), Winchester Creek site (yellow). Graphic: Cornu et al. 2012.
Statistical analysis of four years of SWMP nutrients data (2002-2006) by O’Higgins and Rumrill (2007) showed that of the four West Coast NERRS (Padilla, WA, South Slough, OR, Elkhorn Slough, CA, and Tijuana, CA), South Slough showed least evidence of human-generated nutrient concentrations.
Linear regressions of nitrogen concentrations in South Slough with salinity indicated strong seasonal patterns. Freshwater inflows were the primary nitrogen source during the rainy season, but marine nitrogen sources were increasingly important in the dry season. O’Higgins and Rumrill note that seasonal nitrogen patterns were particularly apparent in South Slough due to the high spatial variability in salinity.
They also concluded that seasonal phosphorus patterns in South Slough were less pronounced than the nitrogen patterns. Marine phosphorus sources were dominant during the rainy season whereas freshwater was the primary phosphorus source during the dry season. They suggest that this anomalous pattern may be due to localized human-generated phosphorus sources from the town of Charleston.
Table 2. Seasonal trends in South Slough nutrient dynamics in the marine zone (blue) and the riverine/brackish zone (red). Significant differences are indicated by the black diamonds. Data: SWMP 2012 .
O’Higgins and Rumrill’s research further suggested that the relationship between chlorophyll a and other nutrient concentrations is statistically significant. For example, increases in DIN were correlated with increases in chlorophyll a. The same is true of PO4 and chlorophyll a at Winchester Creek (riverine/freshwater zone).
With the benefit of six additional years of South Slough nutrients data, we evaluated 10 total years of data using a technique known as “dummy variable regression” (Table 2) to determine the statistical significance of seasonal nutrient concentration patterns in South Slough. Nitrogen, phosphorous, silica, and chlorophyll a concentrations for each month were compared with January nutrient concentrations (which served as rainy season reference values) for each year to identify any statistically significant differences (p < 0.05). To control for serial correlation, the data were lagged by one year.
There was strong statistical evidence that nitrogen is highest in January at both riverine/freshwater and marine/brackish sampling sites (Table 2). Dry season phosphorous concentrations are statistically higher than wet season concentrations at marine/brackish sites, but this difference is not observed at riverine/freshwater sites. During the dry season, silica concentrations experience a statistically significant decrease at marine sites and a significant increase at freshwater sites. However, the evidence supporting this conclusion is somewhat weak because it requires a generous interpretation of the “dry season” at marine sites (April – November) and a conservative definition (exclusively August) at freshwater sites. Dry season peaks in chlorophyll a are statistically significant at both riverine/freshwater and marine/brackish sampling sites.
Figure 13. Site location map of CEMAP sampling stations in the Lower Bay, Upper Bay, Haynes Inlet, and Catching Slough subsystems. Source: Sigmon et al. 2006; CTCLUSI 2010, 2012, 2013, 2014
Nitrogen
DIN concentrations were measured by ODEQ staff at USEPA’s Coastal Environmental Monitoring and Assessment Program (CEMAP) sites in Lower Bay, Upper Bay, Haynes Inlet, and Catching Slough subsystems during the dry seasons of 1999-2006 (Figure 13). The resulting average DIN concentrations met USEPA standards for “good” water quality (Figure 14)(Sigmon et al. 2006).
Phosphorus
The mean PO4 concentrations at CEMAP sites in the same subsystems also met USEPA standards for “good” water quality (< 0.07 mg/L)(Sigmon et al. 2006; USEPA 2012)(Figure 14).
The highest mean PO4 concentrations were recorded in the Upper Bay subsystem near downtown Coos Bay, Haynes Inlet and at the southern end of the Lower Bay (Figure 8c).
Figure 14. Average total DIN, PO4, and chlorophyll a at CEMAP stations (1999-2006). Symbols represent sampling sites averaged within each subsystem. Error bars define ±1 standard deviation. Lower values (green background) represent healthier levels than higher values (red background). Data from the CEMAP program by ODEQ, retrieved from: http://deq12.deq.state.or.us/lasar2/
Chlorophyll a
All CEMAP sites in the Lower Bay, Upper Bay, and Haynes Inlet subsystems met the USEPA standards ( < 15 µg/L) for chlorophyll a (Sigmon et al. 2006; Brown et al. 2007)(Figure 14). Chlorophyll a concentrations were highest near the mouth of the estuary in the Lower Bay subsystem and near downtown Coos Bay in the Upper Bay subsystem (Figure 8d).
It should be noted that CEMAP data were only collected during the dry season when PO4 concentrations are typically the highest, DIN concentrations are the lowest, and chlorophyll a concentrations are the highest in the riverine/brackish water zone and the lowest in the marine zone. Wet season data are needed to more fully characterize nutrient concentrations in Coos estuary subsystems.
Phosphorus, nitrogen, and chlorophyll a concentrations were sampled (also during the dry season only) in the Upper and Lower Bay subsystems by the Confederated Tribes of Coos, Lower Umpqua, and Siuslaw Indians (CTCLUSI) at three stations (Figure 13).
Their data indicate consistently elevated concentrations of nitrogen at the Kentuck Slough station in the Upper Bay subsystem (Table 3)(CTCLUSI 2010). The Kentuck sampling site is downstream from agricultural lands and directly adjacent to a golf course, which may explain the high nitrogen concentrations there. Nutrient sampling at this site was discontinued in 2012, and a new site in the Lower Bay subsystem was established (Figure 13 “Empire Station”). Further investigation is needed to help understand the elevated phosphorus concentrations at the Empire Station in the 2013 sampling season. Table 3 (right)The BLM and Empire stations are in the Lower Bay; Kentuck is about one mile up Kentuck Slough, adjoining the Upper Bay subsystem. Shaded bars indicate relative nutrient concentrations. Numbers in orange represent values in the “fair” health range (0.07-0.1 for phosphorus; 0.5-1.0 for nitrogen). Numbers in red indicate values that exceed criteria for healthy waters (>0.1 for phosphorus; > 1.0 for nitrogen; >15 for chlorophyll a). Data from: CTCLUSI 2010, 2012, 2012, 2013, 2014.
Figure 15. Isthmus Slough site location map. Source: ODEQ 2007; Sigmon et al. 2006)
Isthmus Slough
Nitrogen
For a ODEQ (2007) dissolved oxygen (DO) study in Isthmus Slough, scientists sampled nitrogen (DIN), phosphorus, and silica among a larger suite of water quality parameters at six ODEQ sites (Figure 15, Table 4).
Except for the most upstream site at the Noble Creek tide gate (in the riverine/brackish water zone), average annual DIN concentrations met USEPA standards (<0.5 mg/L)(USEPA 2012)(Figure 16). As expected, monthly mean DIN concentrations for all sites were low in the dry season and high during the rainy season and mostly remained between USEPA’s “good” and “poor” water quality standards (Figure 16).
In contrast to the ODEQ DO study, CEMAP dry season data (2001 and 2005) at three Isthmus Slough stations (Figure 15) indicated low DIN concentrations at the most upstream stations and high DIN concentrations near the mouth of the slough (Sigmon et al. 2006).
This difference may reflect seasonal patterns in nitrogen sources (e.g., Figure 17) as also documented in a study of South Slough by O’Higgins and Rumrill (2007), who concluded that marine nitrogen sources become increasingly important during the dry season months. All CEMAP data in Isthmus Slough met USEPA DIN standards (< 0.5 mg/L)(USEPA 2012).
Figure 18. Location of ODEQ monitoring sites in Isthmus Slough and mean monthly PO4 concentrations (April 2006 – March 2007). Omitted data bars indicate months for which there are no data. Data: ODEQ 2007
Phosphorus
ODEQ’s 2007 PO4 Isthmus Slough data follow the opposite seasonal pattern to nitrogen, with peak PO4 concentrations mostly occurring in the dry months and lower concentrations during the rainy season (Figure 18, Table 4).
Based on one year of data, the seasonal PO4 shift in Isthmus Slough is less distinct than in South Slough, particularly during the rainy season. At the freshwater Isthmus Slough sites, PO4 concentrations appear to either increase or remain unchanged during the rainy season (Figure 18 , Table 4). Data from additional years could clarify the seasonal patterns.
Mean PO4 concentrations at the three Isthmus Slough CEMAP monitoring stations were higher at the marine station (0.0473 mg/L) than at both the mid-slough station (0.03 mg/L) and the freshwater station (0.011 mg/L)(see blue boxes Figure 18)(Sigmon et al. 2006). Average CEMAP observations at all three Isthmus Slough sites met USEPA’s “good” water quality standard (< 0.07 mg/L).
In Isthmus Slough, the relationship between salinity levels and PO4 concentrations is statistically significant (p < 0.01) near the mouth of the slough (marine/polyhaline zone). The relationship, however, is less clear/not significant for upstream sites (riverine/freshwater zone). This suggests that the ocean is a substantial source of PO4 for sites near the mouth of the slough, but less influential at upstream sites (Figure 19).
Figure 16. Average monthly DIN at all Isthmus Slough sites (2006-2007). Dashed lines represent USEPA’s criteria with values below 0.5 mg/L (green) considered good and values above 1.0 mg/L (red) considered poor water quality. The legend lists sites in order of marine to fresh (left to right). Data: ODEQ 2007
Chlorophyll a
Although ODEQ data (2007) for chlorophyll a in Isthmus Slough are relatively sparse, available data (and logic) suggest that chlorophyll a increases through summer months when chlorophyll-bearing phytoplankton are abundant in estuaries. Maximum chlorophyll a concentrations at all ODEQ Isthmus Slough monitoring sites were approximately 8 µg/L, well within the USEPA water quality standards (“good” < 15 µg/L)(Brown et al. 2007). Chlorophyll a concentrations do not seem related to a salinity gradient or proximity to the mouth of the slough.
An interesting relationship can be seen between chlorophyll a and silica concentrations. Periods of high phytoplankton abundance in summer months (including diatoms), correlate to greater chlorophyll a abundance and lower concentrations of silica, due to diatoms’ silica uptake for shell formation (Figure 20).
Coos River
Nitrogen
Figure 21. Coos River sampling site location map. Source: ODEQ 2006, 2009; Sigmon et al. 2006.
Nitrogen was monitored in the Millicoma and Coos Rivers by ODEQ from 1997-2012 (Figure 21).
For the Millicoma River sites, the seasonality of nitrogen concentrations is evident judging particularly from the one sampling site where fifteen years of data are available- the Rook Higgins boat ramp. Nitrate/nitrite concentrations were very low at all sampling sites during the dry summer months and peaked in the rainy season. Figure 22 shows the seasonal nitrate/nitrite concentration pattern from 1997-2012. At that site, peak summertime concentrations routinely exceeded USEPA’s “fair” water quality standard ( > 0.5 mg/L) and occasionally exceeded USEPA’s “poor” standard (> 1.0 mg/L)(USEPA 2012).
Ammonia concentrations were frequently below detectable limits on the Millicoma River (USEPA 2012).
DIN concentrations, measured on the Coos River at two CEMAP project sites (Figure 21), were very low (mean = 0.104 mg/L)(Sigmon et al. 2006).
Phosphorus
PO4 was measured at two Coos River CEMAP sites (Figure 21) and the mean PO4 concentrations (0.005 mg/L) were well within USEPA standards (< 0.07 mg/L = “good”)(Sigmon et al. 2006; USEPA 2012).
ODEQ (2006, 2009) also measured PO4 on both the Millicoma and South Fork Coos Rivers (Figure 21). Similar to CEMAP, these observations suggest that PO4 concentrations have met USEPA standards.
Figure 22. Seasonal variation (January/winter; July/summer) of nitrate/nitrite for the Rook Higgins boat ramp station on the Millicoma River (1997-2012). Lower values (green background) represent healthier levels than higher values (red background). Data from ODEQ, retrieved from: http://deq12.deq.state.or.us/lasar2/
Silica
Silica was sampled by ODEQ during two consecutive days in August 2006 for their South Fork Coos River Summer Synoptic Study (Figure 21: “ODEQ 2006” sites). Concentrations of SiO2 ranged from 7.42 mg/L to 8.42 mg/L, averaging 7.95 mg/L (<6.0mg/L – <7.5mg/L)(ODEQ 2006).
Generally, Coos River silica concentrations were higher than South Slough concentrations, which were about 2 mg/L on average (Figure 10), and also higher than Isthmus Slough concentrations, which averaged approximately 6 mg/L (Figure 18).
ODEQ also sampled silica during three consecutive days in October, 2009 for the Millicoma River TMDL Dissolved Oxygen Study (Figure 21: “ODEQ 2009” sites). The concentration of SiO2 in the Millicoma River during the three day sample event ranged from 2.76 mg/L to 8.38 mg/L, averaging 5.33 mg/L.
Figure 17. Seasonal variation of nitrate/nitrite and salinity for the Isthmus Slough at the Eastside Bridge site (2006-2007). The data exhibit a strong negative correlation between salinity and nitrate/nitrite concentrations, with high seasonal salinity (blue line) peaks (dry seasons) corresponding with seasonal decreases in low nitrogen (red line) in the dry season (May-October) and low salinity (rainy season) corresponding with high nitrogen concentrations. Data: ODEQ 2007
Figure 19. Relationship between PO4 levels and salinity at three Isthmus Slough sites. Data: ODEQ 2007
Figure 20. Chlorophyll a concentrations plotted with SiO2 abundance at three Coos estuary sites (2007). Data: ODEQ 2007
Table 4. All values for nutrients sampled during ODEQ’s Isthmus Slough/South Fork Coos River DO Study. Values in bold red font indicate values that exceeded the Oregon Watershed Enhancement Board (OWEB) recommended evaluation criteria for total nitrates or total phosphorus. Dates in bold black font indicate wet season sample events. Data: ODEQ 2007
Nitrogen concentrations in the Coos estuary and associated tributaries change as a result of wet season runoff from the Coos watershed. Lee II and Brown (2009) suggest that the Coos estuary’s main nitrogen source is non-point source inputs from forested lands, which is common in most West Coast estuaries (Quinn et al. 1991). This helps explain the observed seasonal patterns in this summary: high nitrogen concentrations during the wet season and low concentrations during the dry season.
The relative contribution of nitrogen from upland forests is influenced by the plant communities in the riparian zone. Red alders (Alnus rubra), for example, are “nitrogen fixers” (plants able to convert atmospheric nitrogen into usable compounds). They store nitrogen in nodules on their roots which, in turn, enriches surrounding soils and ultimately surrounding wetlands and waterways. Riparian areas dominated by red alders can be responsible for over 80% of riverine nitrogen loading, as often occurs in Oregon Coast Range stream systems (Brown and Ozretich 2009). Low nitrogen concentrations in the Coos system indicate local riparian zones with relatively few alders or other deciduous trees (Lee II and Brown 2009).
During the dry season, ocean conditions are responsible for nitrogen contributions to the estuary. Spring and summer upwelling events, which draw nutrient-rich bottom waters to the ocean surface, elevate nitrate (and phosphate) concentrations in the estuary (see sidebar). This is particularly true near the mouth of the estuary, or “ocean-estuary interface” (Lee II and Brown 2009).
In August 2005, Lee II and Brown (2009) used a nitrogen isotope extracted from macroalgae to determine nitrogen sources at various locations in the Coos estuary (Figure 23).
Lee II and Brown found that for mid and upper bay sites in Haynes Inlet, North Bend, and Cooston Channel, roughly 90% of the nitrogen was ocean-sourced, about 10% from waste water treatment facilities or septic systems, and about 2% was river-sourced.
Similarly, ocean-sourced nitrogen dominated the nutrient profile at the Lower Bay and South Slough sites (about 85% ocean).
Phosphorus
As noted in the summary above, seasonal patterns of PO4 concentrations in the Coos system are characterized by higher concentrations in the dry season and lower concentrations in the rainy season (opposite to nitrogen). High PO4 concentrations result from ocean upwelling events (see sidebar).
Rainy season PO4 concentration declines can be explained by the absence of upwelling-driven nutrients and simple dilution by freshwater inputs from swollen rivers with naturally low PO4 concentrations (O’ Higgins and Rumrill 2007, Cornu et al. 2012).
Quinn et al. (1991) found that point sources (i.e., land-based wastewater treatment and industrial facilities) contributed approximately 60% of the PO4 in the Coos estuary. Because the watershed contains relatively few urbanized areas to contribute phosphates, concentrations remain relatively low during wet winter months (Cornu et al. 2012).
Figure 23. Station locations of macroalgae samples taken for δ15 N, an isotope used to determine nitrogen sources. Project area subsystems are named and outlined in blue. Shaded subsystems had no data from this source. Data: Lee II and Brown 2009.
Silica
Seasonal silica patterns are complex, because they depend on many factors and change along the salinity gradient (Figure 10). In the wet season, precipitation and rapid runoff dilute silica concentrations (Sigleo and Frick 2003). In the dry season, the interaction of nutrient delivery from upwelling, diatom uptake, and river discharge rates determine whether silica increases or decreases.
In the summer/dry season, silica concentrations are affected by natural events such as ocean upwelling and diatom uptake. Prolonged exposure to sunlight fuels increased primary production and corresponds to peak diatom abundance during the summer months. Because diatoms use silica to develop shell-like structures called “frustules” (see sidebar), silica concentrations vary with diatom abundance. This pattern is observed in the SMWP data as well as its correlation with chlorophyll a concentrations (a measure of primary production)(Figure 24).
The response to increased primary production during the dry season varies across the salinity gradient. Although diatoms are more abundant during the summer months in all estuarine environments, peak diatom abundance is greatest in the lower estuary (e.g. near the ocean where diatoms are naturally more prevalent than in upland freshwater streams)(Figure 25). As the populations of diatoms increase during the dry season in the lower estuary, their uptake of silica to build frustules also increases. If the rate of uptake outpaces silica delivery from upwelling, silica in the water will decrease (e.g., In Figure 10, the Charleston site displays low SiO2 in the dry season). In contrast, a net increase in silica occurs if the rate of nutrient delivery from upwelling exceeds diatom uptake during the dry season. This increase in silica is observed in the upper estuary where diatoms are less abundant (e.g., Figure 10: Winchester site).
Seasonal patterns in diatom abundance and silica concentrations are also affected by river flow. For example, Colbert and McManus (2003) reported that phytoplankton (diatoms) in Isthmus Slough were rapidly flushed from the estuary during high river flows and therefore had no significant effect on silica during the wet season. As river discharge rates progressively decrease from winter through summer, the residence time for diatoms lengthens and increases their effect on silica concentrations.
Figure 25. Seasonal patterns for two diatom species. Pennate diatom (dashed) and centric diatom (dotted) abundance at the marine-estuarine interface (top), the estuarine-mixing zone (middle), and the riverine zone (bottom) are plotted against estimated dates of spring transition (green), which marks the start of summer upwelling events, and fall transition (red), which representes at the end of the summer upwelling season. Data: Rumrill 2003
Diatoms are a group of abundant, single-celled algae in marine, estuarine, and freshwater environments. They are a major component of the phytoplankton community, which includes microscopic plants, bacteria, and protists.
Diatoms play a crucial role in the maintenance of aquatic food webs and are central to nutrient dynamics. For example, diatoms account for approximately 20% of the global carbon fixation (conversion of carbon dioxide and water into sugars).
Diatoms require silica to develop their characteristic shell called a “frustule.” Because silica is often a limiting nutrient for diatom growth, it is an important factor in primary production (i.e., plant growth) in estuarine waters.
Sources: Martin-Jezequel et al. 2000, Round et al. 1990, Armbrust et al. 2004, Otzen 2012.
For example, both phosphorus and nitrogen are necessary for the growth of marsh plants, algae, and phytoplankton which forms the base of the estuarine food web (USEPA 2012). Both elements are also key components of chemical fertilizers used on agriculture lands, golf courses, and lawns. Because phosphorus and nitrogen are highly soluble and readily mobilize in both surface and ground waters, excess nutrients can accumulate in rivers, lakes, and estuaries. These high nutrient concentrations negatively affect water quality by contributing to eutrophication (i.e., excessive primary productivity -such as phytoplankton or algae blooms- in estuarine waters) and related deficiencies in dissolved oxygen (DO) that are called “hypoxic” when DO is low in the water column and “anoxic” when DO is absent. Eutrophication and hypoxic/anoxic conditions directly and indirectly affect fish, wildlife, and human communities.
Ocean upwelling is a wind-driven phenomenon that influences seasonal nutrient abundance in coastal ocean waters. Upwelling occurs when strong north winds drive surface ocean water along the coast and offshore in a process called “Ekman transport”. Cold, nutrient-rich ocean water from the depths rises up to the surface to replace surface water transported by the wind.
Typically during the months of April through September, Oregon coast winds cause coastal upwelling events. This upwelling results in the enrichment of near-shore waters, which promotes plankton growth. Abundant plankton supports marine life which in turn supports seabirds, marine mammals, and various fisheries, including Dungeness crab, Pacific sardines, Chinook salmon, albacore tuna, and halibut.
Sources: Peterson et al. 2013, Iles et al. 2011, Dalton et al. 2013
Another nutrient, silica, is a product of geological weathering and erosion. Silica is also used by planktonic organisms that are vitally important to the ocean/estuarine food web. DeMaster (1991) estimated that “siliceous” biota (i.e. plants and animals that require silica for proper physiological development) account for as much as one-third of the world’s oceans’ primary productivity.
Silica is also an indicator of water quality in estuaries. For example, “silica-limiting” systems (i.e., estuaries in which the limited availability of silica constrains primary production) are often associated with the over-enrichment of nitrogen or phosphorus (USEPA 2014).
Further, the availability of silica in estuarine waters ensures a healthy mix of plankton species, reducing the likelihood that shifts in plankton communities will have deleterious consequences. When both nitrogen and phosphorus are overabundant and silica is limited, the disproportionate growth of non-diatom populations may produce harmful algal blooms such as toxic red and brown tides (Schaffner et al. 2007).
Lastly, chlorophyll a is a measure of phytoplankton biomass in the estuary. Like land plants, phytoplankton growth requires carbon dioxide, sunlight, and nutrients. Nutrient enrichment in the estuary causes phytoplankton and other plankton populations to expand rapidly (plankton blooms), which provide higher taxa (e.g., invertebrates, fish, whales) with an abundant food source. However, overly large plankton blooms can cause an accumulation of dead phytoplankton that leads to a subsequent bloom in oxygen-metabolizing decomposers. Large scale decomposition in the water column reduces the availability of dissolved oxygen which, in turn, affects higher taxa while also decreasing the water clarity needed for submerged aquatic vegetation to grow.
In studies of nutrient-related water quality, the Coos estuary, for the most part, compares well with other Oregon estuaries. In a 2009 report by USEPA’s Western Ecology Division, Lee II and Brown reported that rainy season DIN concentrations in the Coos estuary were generally lower than six other Oregon coast estuaries. Conversely, during the dry season, Coos estuary ammonium concentrations ranked 2nd highest. The Coos estuary was ranked 4th for combined dry season nitrate and nitrites at salinities greater than 5. For phosphorus, the Coos system has the lowest loading by volume of the seven Oregon estuaries sampled but had the highest dry season orthophosphate ranking (PO4 median = 0.9 μM)(Lee II and Brown 2009).
Figure 24. Significant relationships (p <0.05) between SiO2 concentrations and chlorophyll a levels in South Slough.
Data: SWMP 2012